
Each month, Kalibri Labs analyzes booking data for more than 34,500 U.S. hotels and delivers key...
Press
December 11th, 2019 – ROCKVILLE, MD
Kalibri Labs’ U.S. Hotel Industry Performance Overview (HIPO) reveals that the digital channels, Brand.com and OTA, as a percent of the total bookings continue to accelerate, while Property Direct declines. Given 10 months of consecutive growth, the Brand.com year-to-date (YTD) bookings are up +7.7% compared to the same period last year and are growing faster than OTA (+7.1%) as a portion of the actualized demand. As of October YTD, Brand.com accounted for 24.5% of actualized demand while OTA represented 16.3%.
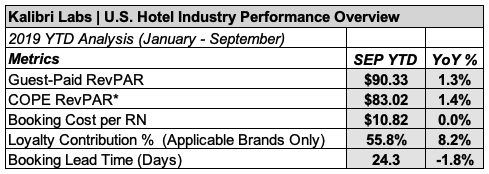
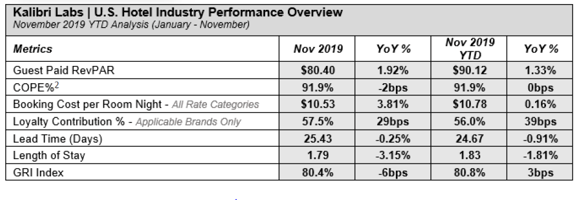
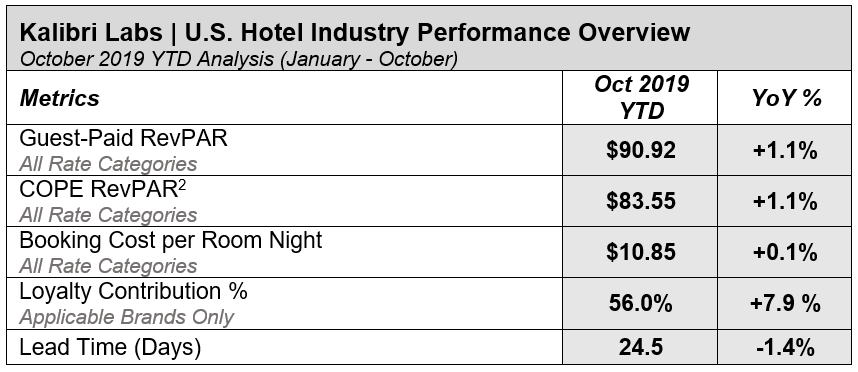
Both the Brand.com and OTA channels cost more per booking than Property Direct bookings, impacting the overall U.S. COPE Percent1, which represents the percent of revenue retained after booking costs are removed. On average in October, the Brand.com channel booking costs were $9.21 per occupied room, OTA booking costs were $22.43, and Property Direct booking costs were $2.61. As of October, the U.S. COPE Percent was 91.9%, a -0.24% decrease year-over-year. “Effectively, hotels spent 8.1% of their top-line revenue in October on direct booking costs, excluding Sales and Marketing expenses,” said Cindy Estis Green, CEO of Kalibri Labs, “this decline in COPE percent has been a trend over the past several months, led largely by the continued shift to more costly online channels.” (Booking costs include channel and transaction fees, retail and wholesale commissions, loyalty fees, and amenity costs.)
For the total U.S. as of October YTD, growth in loyalty member bookings and Brand.com bookings appear to be related. In fact, U.S. YTD loyalty contribution through Brand.com was 88.6%. However, total loyalty contribution across all channels varied throughout the top 10 markets displayed in the Kalibri Labs October HIPO report, ranging from 47.9% to 58.8%. Washington DC actualized 58.8% of total room nights driven by loyalty members (+2.8% higher than the US), with 26.0% of all bookings made through Brand.com (1.5% higher than the US), and almost nine out of ten Brand.com bookings (89.8%) flagged as loyalty members (1.2% higher than the US).
Across the top 10 markets, lead time varied significantly. As of October YTD, New York City (NYC) hotel guests booked 2.5 weeks earlier than guests in Houston. While in NYC, guests booked more than 5 weeks prior to their stay, Houston guests booked less than 3 weeks prior to their stay. Within NYC, Upper Upscale hotels drove the lead time, such that hotel guests at Upper Upscale hotels made their reservations an average of 40 days prior to their stay.
The full details of the U.S. Hotel Industry Performance Overview are available at kalibrilabs.com. Kalibri Labs now offers a complimentary Market Kalibration newsletter that provides a summary of U.S. hotel performance trends. Visit kalibrilabs.com/trends to download the latest edition.
image-block-outer-wrapper
layout-caption-below
design-layout-inline
combination-animation-none
individual-animation-none
individual-text-animation-none
"
data-test="image-block-inline-outer-wrapper"
>
sqs-block-image-figure
intrinsic
"
style="max-width:858px;"
>
sqs-block-image-link
"
href="https://www.kalibrilabs.com/trends"
>
class="image-block-wrapper"
data-animation-role="image"
>
>
*Contribution to Operating Profit and Expense - Revenue per available room based on the total room revenue paid by guests, after transaction-specific direct reservation costs have been deducted (i.e.: retail commissions, wholesale commissions, channel costs, TA amenity costs, and loyalty investment).
1 - The proportion of Guest Paid revenue kept by a hotel after all booking costs have been deducted. COPE % is COPE Revenue divided by Guest Paid Revenue.
2 - Contribution to Operating Profit and Expense - Revenue per available room based on the total room revenue paid by guests, after transaction-specific direct reservation costs have been deducted (i.e.: retail commissions, wholesale commissions, channel costs, TA amenity costs, and loyalty investment).
About Kalibri Labs:
Kalibri Labs evaluates and predicts revenue performance using its proprietary algorithm to generate the Optimal Business Mix for individual hotels, revealing the most promising opportunities to pursue along with specific direction on how to find and convert them. The Hummingbird PXM revenue strategy and benchmarking platform also includes the industry’s most robust profiles for travel agent and OTA production. The Kalibri Labs database, updated monthly, is comprised of ADR, room revenue, room nights and acquisition costs from over 7 billion guest stays adding 100 million each month from over 33,000 hotels dating back more than 5 years to give an expansive view of the U.S. hotel industry. Real estate developers, brokers and others involved in hotel transactions use Kalibri Labs data to improve underwriting with a more granular view of each market and benchmarks and trendlines for both individual hotels and sub-markets for all U.S. metro areas. For more information, please visit KalibriLabs.com or contact info@kalibrilabs.com.
MEDIA CONTACT: Jeremy Gilston jeremy@kalibrilabs.com