
Each month, Kalibri Labs analyzes booking data for more than 34,500 U.S. hotels and delivers key...
Press
January 16th, 2020 – ROCKVILLE, MD
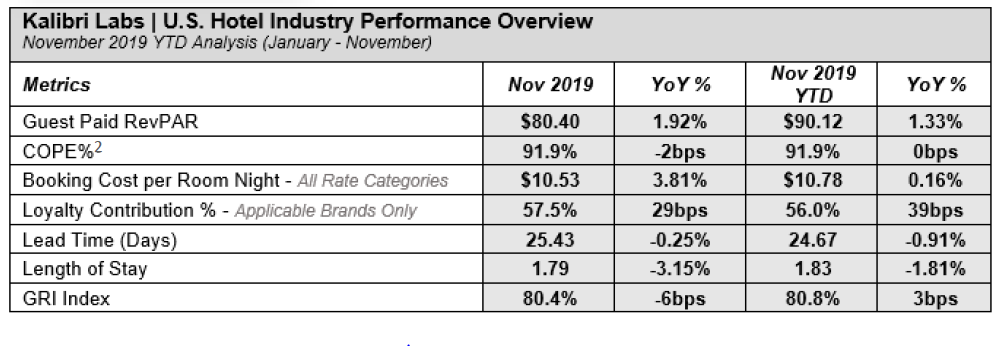
"Our November 2019 Market Kalibration report showcases several underappreciated bright spots in the US hotel industry, along with a few key areas where additional optimization by operators, CVBs, and asset management could yield enhancements in profitability and returns," said Mark Lomanno, Partner and Senior Advisor, Kalibri Labs.
"One always has to be cognizant of holiday shifts, such as the shift in the timing of Thanksgiving this month, as well as other potential influences such as weather; however, examining November's results within the broader context of the year-to-date trends provides an excellent starting point for maximizing growth and profitability."
Noteworthy in November and Year-to-Date (YTD):
-
Growth in hotel demand exceeded supply growth, both in November, and YTD, as evidenced by increases in both Guest Paid RevPAR and Occupancy.
-
Both the November and YTD booking window and average length of stay continue to compress, making optimal channel mix more important than ever.
-
The gap between Guest Paid Revenue and Hotel Collected Revenue increased in both November and YTD as compared to the same period last year, suggesting that additional channel optimization could lead to higher revenue capture.
-
YTD growth in Brand.com room nights outpaced growth in OTA room night growth through November and exceeded branded hotel supply growth by a wide margin. As of Q3 2019, supply growth remained at 2% year-over-year1.
-
Total US loyalty contribution increased +7.6% year-over-year as of YTD to 56.0% of total bookings. When the book direct campaigns began in 2016, total year-end US loyalty contribution was 47.9%.
-
As of November YTD, the higher a property's Global Review Index (GRI), a measure of online reputation by ReviewPro, the more booking cost controls the properties exhibited. Properties rating over 90% GRI experienced -2.5% in bookings costs while those properties rating below 75% GRI had +3.3% booking costs.
Market-Specific Highlights:
-
In November, Miami experienced above-average occupancy gains, offset by declines in both Guest Paid ADR (-2.6%) and COPE2 ADR (-3.0%). This suggests declining channel mix efficiencies given that not only the average Guest Paid ADR is decreasing, but also the mix of business is becoming more expensive to attain.
-
New York City’s length of stay is down over 11% YTD, the largest decline in the top ten markets, and the booking window continues to compress. These metrics suggest that layering on additional group business or considering promotions aimed at increasing length of stay earlier in the booking window may enhance profitability.
-
Hotels in Los Angeles and Chicago, on average as of YTD, experienced declines in Guest Paid ADR despite above-average occupancy gains, suggesting opportunities for more profitable distribution strategy.
Additional Data Insights:
-
Kalibri Labs data insights are available at every level from industry-wide to property-specific, providing immediately actionable insights and catalysts for profitable change.
image-block-outer-wrapper
layout-caption-below
design-layout-inline
combination-animation-none
individual-animation-none
individual-text-animation-none
"
data-test="image-block-inline-outer-wrapper"
>
sqs-block-image-figure
intrinsic
"
style="max-width:1002px;"
>
sqs-block-image-link
"
href="https://www.kalibrilabs.com/trends"
>
class="image-block-wrapper"
data-animation-role="image"
>
>
*Contribution to Operating Profit and Expense - Revenue per available room based on the total room revenue paid by guests, after transaction-specific direct reservation costs have been deducted (i.e.: retail commissions, wholesale commissions, channel costs, TA amenity costs, and loyalty investment).
The full details of the U.S. Hotel Industry Performance Overview are available at KalibriLabs.com. Kalibri Labs now offers a complimentary Market Kalibration newsletter that provides a summary of U.S. hotel performance trends. Visit kalibrilabs.com/trends to download the latest edition.
1 - “U.S. Hotel Figures Q3 2019.” Mullen, Matt. Q3 2019 U.S. Hotel Figures, CBRE, 29 Oct. 2019, www.cbre.us/research
2 - Contribution to Operating Profit and Expense - Revenue per available room based on the total room revenue paid by guests, after transaction-specific direct reservation costs have been deducted (i.e.: retail commissions, wholesale commissions, channel costs, TA amenity costs, and loyalty investment).
3 - The proportion of Guest Paid revenue kept by a hotel after all booking costs have been deducted. COPE % is COPE Revenue divided by Guest Paid Revenue.
About Kalibri Labs:
Kalibri Labs evaluates and predicts revenue performance using its proprietary algorithm to generate the Optimal Business Mix for individual hotels, revealing the most promising opportunities to pursue along with specific direction on how to find and convert them. The Hummingbird PXM revenue strategy and benchmarking platform also includes the industry’s most robust profiles for travel agent and OTA production. The Kalibri Labs database, updated monthly, is comprised of ADR, room revenue, room nights and acquisition costs from over 7 billion guest stays adding 100 million each month from over 33,000 hotels dating back more than 5 years to give an expansive view of the U.S. hotel industry. Real estate developers, brokers and others involved in hotel transactions use Kalibri Labs data to improve underwriting with a more granular view of each market and benchmarks and trendlines for both individual hotels and sub-markets for all U.S. metro areas. For more information, please visit KalibriLabs.com or contact info@kalibrilabs.com.
MEDIA CONTACT: Jeremy Gilston jeremy@kalibrilabs.com