

HUMMINGBIRD MARKET
Find opportunity in the industry's most granular submarket data.

See what is driving market performance
Hummingbird Market brings superior market and submarket intelligence to hotel owners, operators, asset managers, developers, and investors.
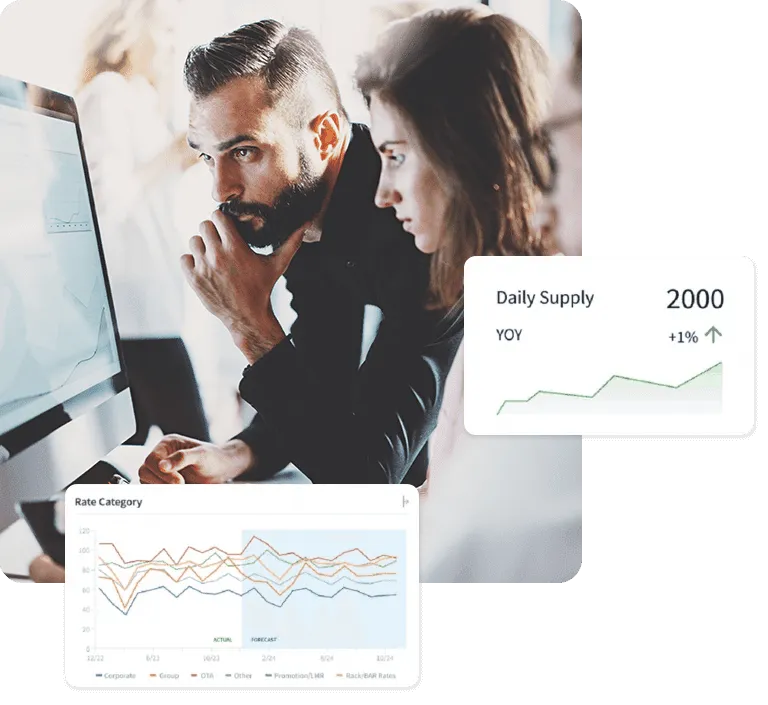
Far more granular than the competition, Kalibri transactional isdata sourced from brands and hotel PMS and CRS systems. It shows the business mix behind occupancy, ADR, and RevPAR so you can see which demand is growing and where you have leverage.
Available in two versions: Core and Plus.

Easy-to-use mapping
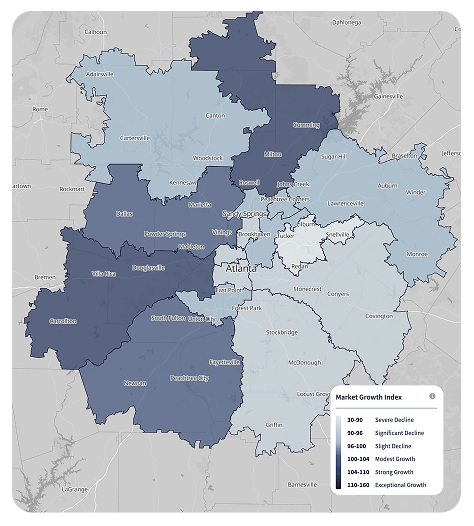
Interactive heat maps with smart filters take you from the national view to a submarket in minutes.

Granular data
Rate category, channel, and length-of-stay detail that reveals profit opportunity high-level metrics can hide.
Cost Efficient
Priced for the discovery stage, when time and budget both matter.
What's in the data

What teams use it for


Kalibri data reveals opportunity hidden by legacy RevPAR data.
Before Kalibri
Kerry Ranson, Partner & President of Operations at Raines, was looking to underwrite on an Extended Stay property.
Based on RevPar data found on legacy data reports, they couldn’t make the numbers work at all.
Conclusion?
Zero opportunity in the market.

After Kalibri
Soon after he was able to look at Kalibri LOS data.
It revealed a very different story.
Kerry realized it was a brilliant opportunity. They built the Extended Stay property.
And while typical ES ramp up periods take 1-2 years to stabilize, the demand was so high they stabilized in 3-6 months.
TWO VERSIONS
Core for near-term decisions. Plus for capital decisions.
Both versions share the same data, maps, and length-of-stay detail. Plus adds the history, forecast, and site-level context that investment decisions require.
- 12-month history
- Occupancy, ADR, RevPAR
- Detailed length-of-stay patterns
- Opportunity heat maps
- 10-year market history
- 18-month forecast
- Visual Census of every hotel open and under construction
- Excel and CSV exports, with API integrations coming soon
SIDE BY SIDE
Compare Core and Plus
| Feature | Core | Plus |
|---|---|---|
| Primary purpose | Market orientation and opportunity discovery | Market interpretation for capital decisions |
| Historical coverage | 12 months | 10 years |
| Forecast | Not included | 18-month forecast |
| Data export | Not included | Exports aligned to on-screen analysis |
| Visual Census | Not included | Every hotel open and under construction |
| Integrations | Not included | API integrations (coming soon) |
| Performance metrics | Occupancy, ADR, RevPAR | Occupancy, ADR, RevPAR |
| Length-of-stay analysis | Detailed LOS patterns | Detailed LOS patterns |
| Opportunity heat maps | Included | Included |
| Decision horizon | Near-term | Multi-period and capital planning |
| Best suited for | Market awareness and opportunity discovery | Feasibility, valuation, underwriting, planning |
ONLY IN PLUS
Built for investment decisions
Plus gives owners, developers, and underwriters the history, forecast, and site context to make feasibility, valuation, and underwriting decisions they can defend.
ONLY IN PLUS
Market Comparison
Put any two markets or submarkets side by side on one screen. Compare segment, occupancy share, rate category, length of stay, and forecast to make a like-for-like choice.
ONLY IN PLUS
Visual Census
Add site-level context to submarket performance data.
- Every hotel open and under construction
- Zoom to any location
- Identify clustering and white space
- Filter by brand, class, and chain
ONLY IN PLUS
18-Month Market Forecast
Powered by Kalibri Forecast AI, the same forecasting science behind Kalibri's national outlook. See where demand, pricing, and occupancy are headed before the shift shows up in trailing results.
Heat Maps with Smart Filters Expedite Opportunity Identification
See the statistically best locations to build based on the length of stay segmentation that matters most to you.
Hummingbird Market harnesses the power of Kalibri Data and ProfitMix AI to allow users drill into target areas via heat maps, then examine the details of the composition of demand - including length-of-stay (LOS). No other opportunity research tool can match it.
See maps at the national, state, market and submarket level.
Legacy data tools have become cumbersome and overpriced. Test drive Hummingbird Market.
The granularity that makes you better at your job.
Arturo Jimenez of ARK Hospitality explains how Hummingbird Market data details help him predict the direction of markets and submarkets.
News & Insights
-
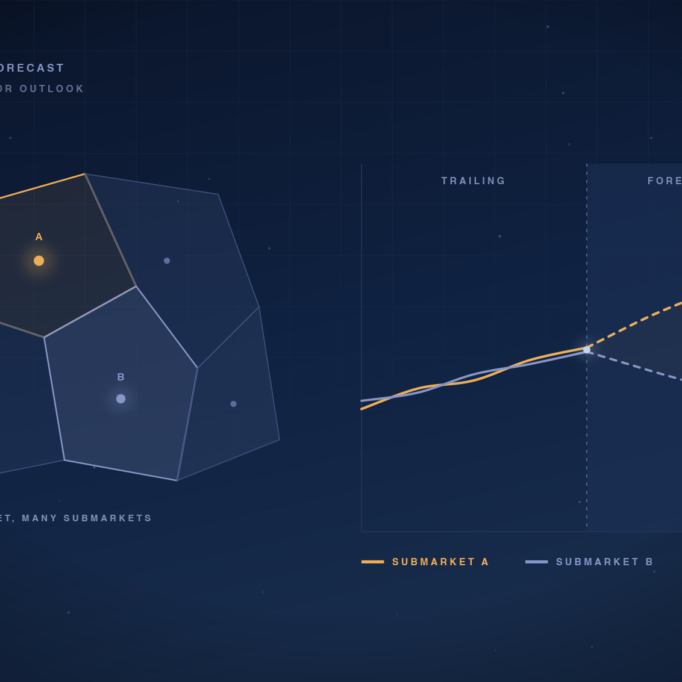
Hotel Demand and ADR Forecasting by Submarket: What to Watch Before Budget Season
Budget season asks commercial and finance teams to commit to a single set of assumptions…
4 min read -
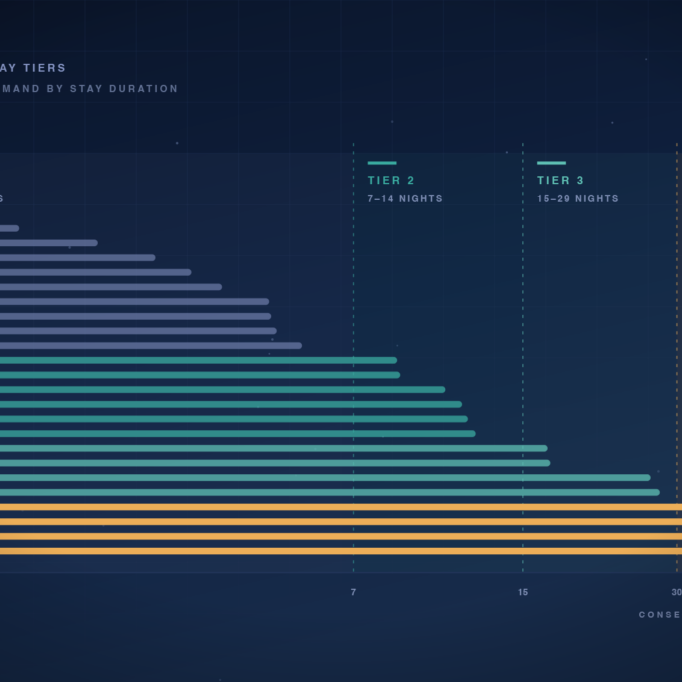
The Length-of-Stay Tiers That Actually Predict Extended Stay Demand
Extended-stay demand doesn’t behave like transient demand, and measuring it with the same tools tends…
5 min read -
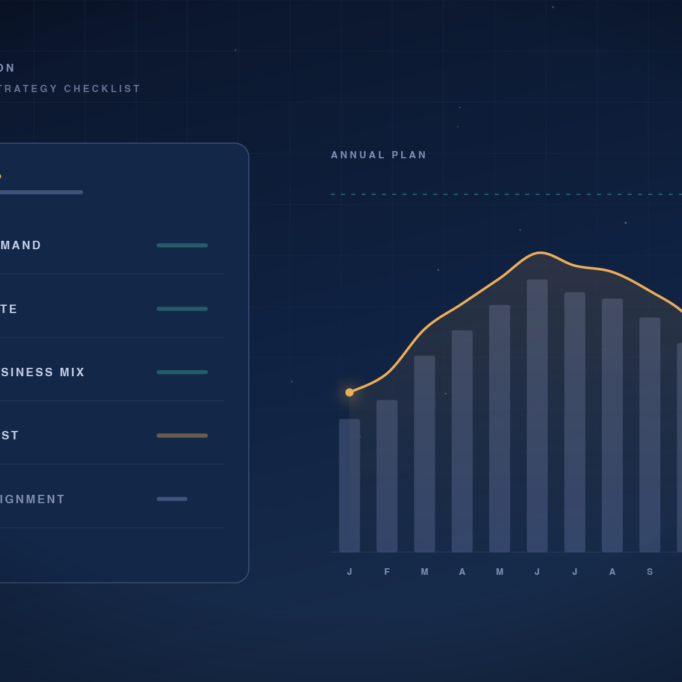
Preparing for Hotel Budget Season: A Commercial Strategy Checklist
Hotel budget season asks commercial and finance teams to agree on a single set of…
5 min read