By: Jeremy Gilston - Manager, Client Solutions
Blog

By: Jeremy Gilston - Manager, Real Estate Revenue Strategy
Hotels funded most of the Moscone Convention Center’s renovation, so which chain scale is seeing the most impact after completion?
Jeremy Gilston analyzes the April 2019 edition of the San Francisco GEO HIPO (Hotel Industry Performance Overview) to find out which types of properties have seen the most tangible benefit from the Moscone Convention Center Renovation.
Background
The Moscone Convention Center, San Francisco’s home to major city-wide events, finished a $551 million expansion the first week of January 2019, increasing the facility’s square footage by 21% and making it the 15th largest convention center in the country (1). Within the Tourism Improvement District of San Francisco, a Moscone Expansion District (MED) was created in 2013 (2) to fund the expansion. As such, hotels covered two-thirds of the construction costs.
The Results
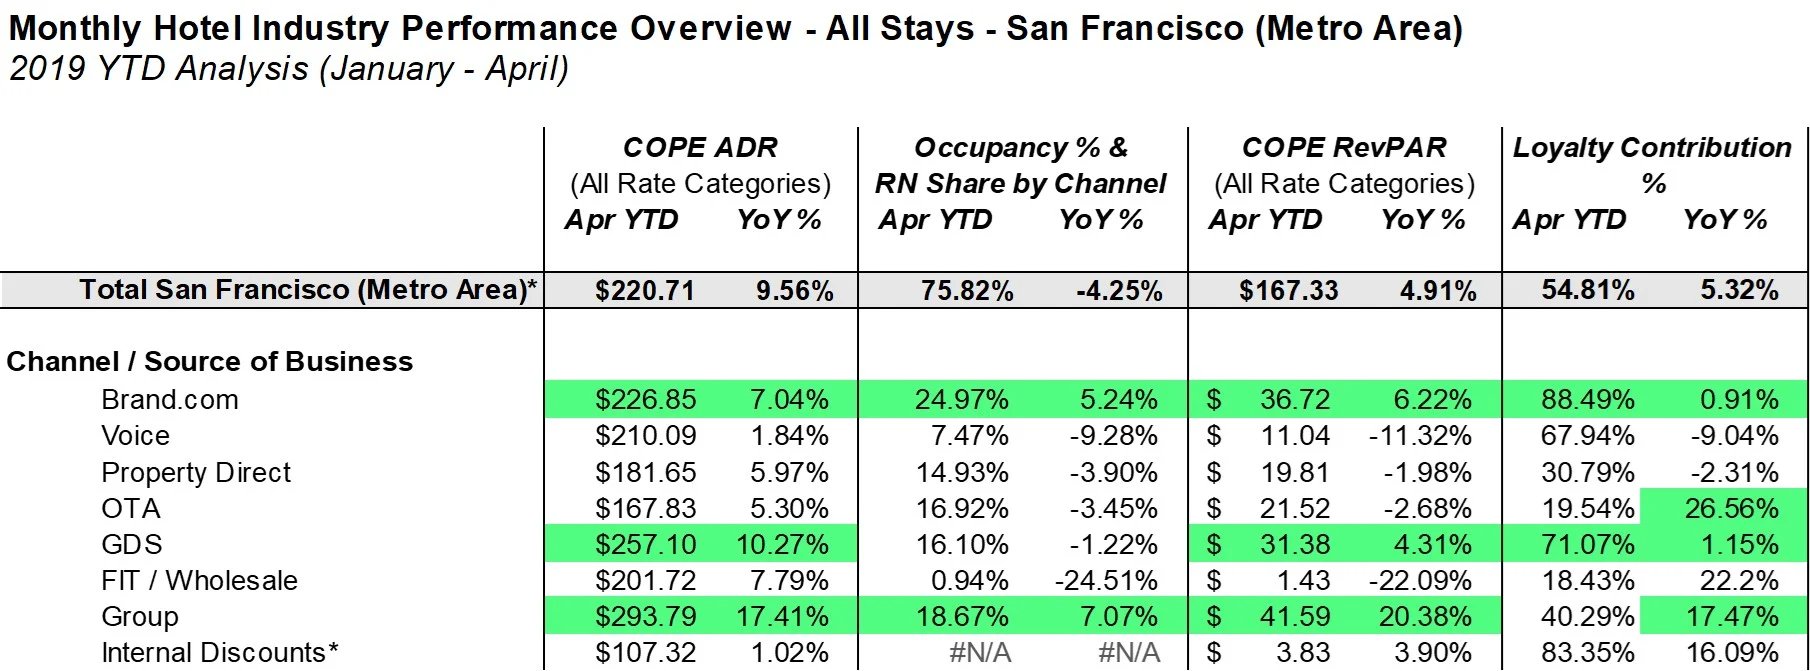
At the chain scale level of detail, it becomes clear that the upper tier hotels are benefiting the most from the Moscone Convention Center improvements. While hotels across all chain scales experienced year-over-year occupancy declines and ADR growth as of April 2019 YTD, Upper Upscale hotels experienced +9.21% COPE RevPAR performance growth as compared to Upper Midscale hotels whose COPE RevPAR declined -5.6%.
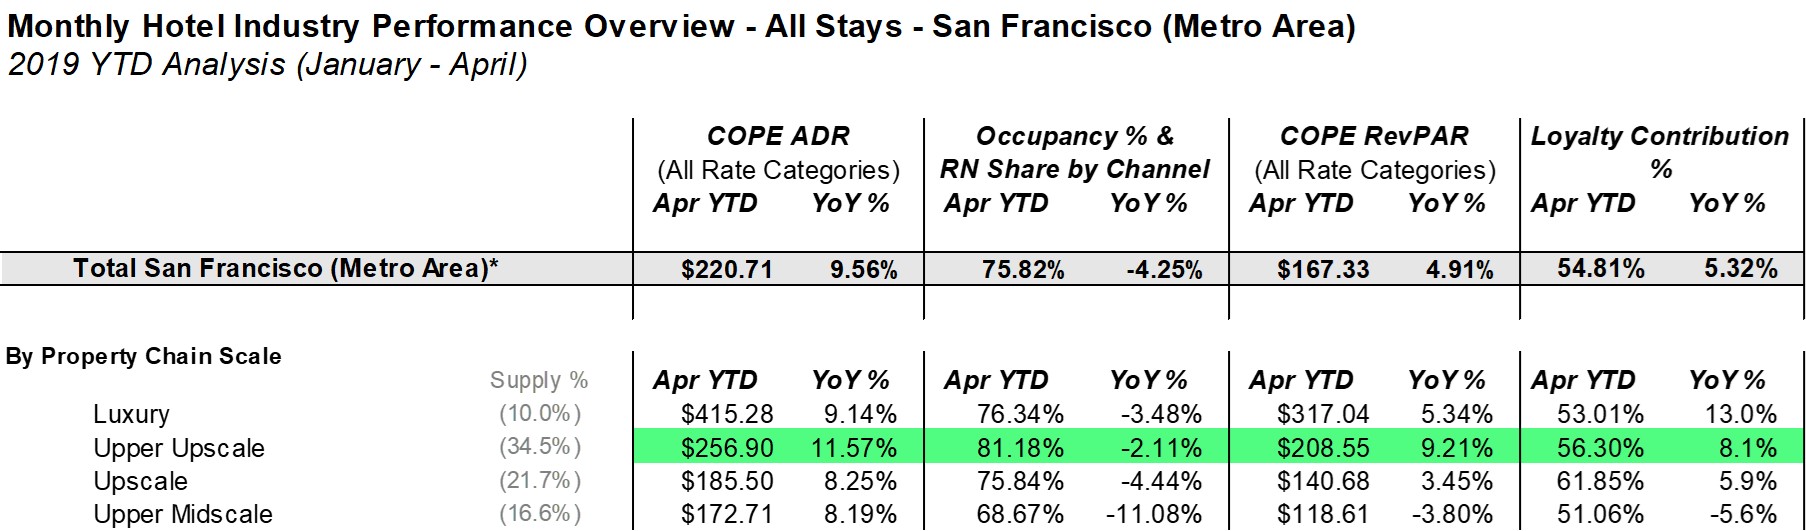
Luxury and Upper Upscale hotels are in closest proximity to the convention center, further explaining why these chain scales benefited the most from the Moscone renovation. Nearby hotels include a Marriott Marquis, The Park Central, W Hotel, and InterContinental.
In addition, the convention center is attracting large technology industry and high-profile events (3), whose attendees tend to prefer upper tier hotels. For example, the largest gathering of presidential candidates in California since September 2015 occurred at Moscone in the first week of June 2019. For these reasons, the market’s channel mix and growth trends are expected to continue in 2019 in line with April 2019 YTD figures.
The Details
The highly granular view of market performance in the San Francisco GEO-HIPO illuminates the true drivers of growth from the Moscone Convention Center renovations, which is highlighted in the graphic below.
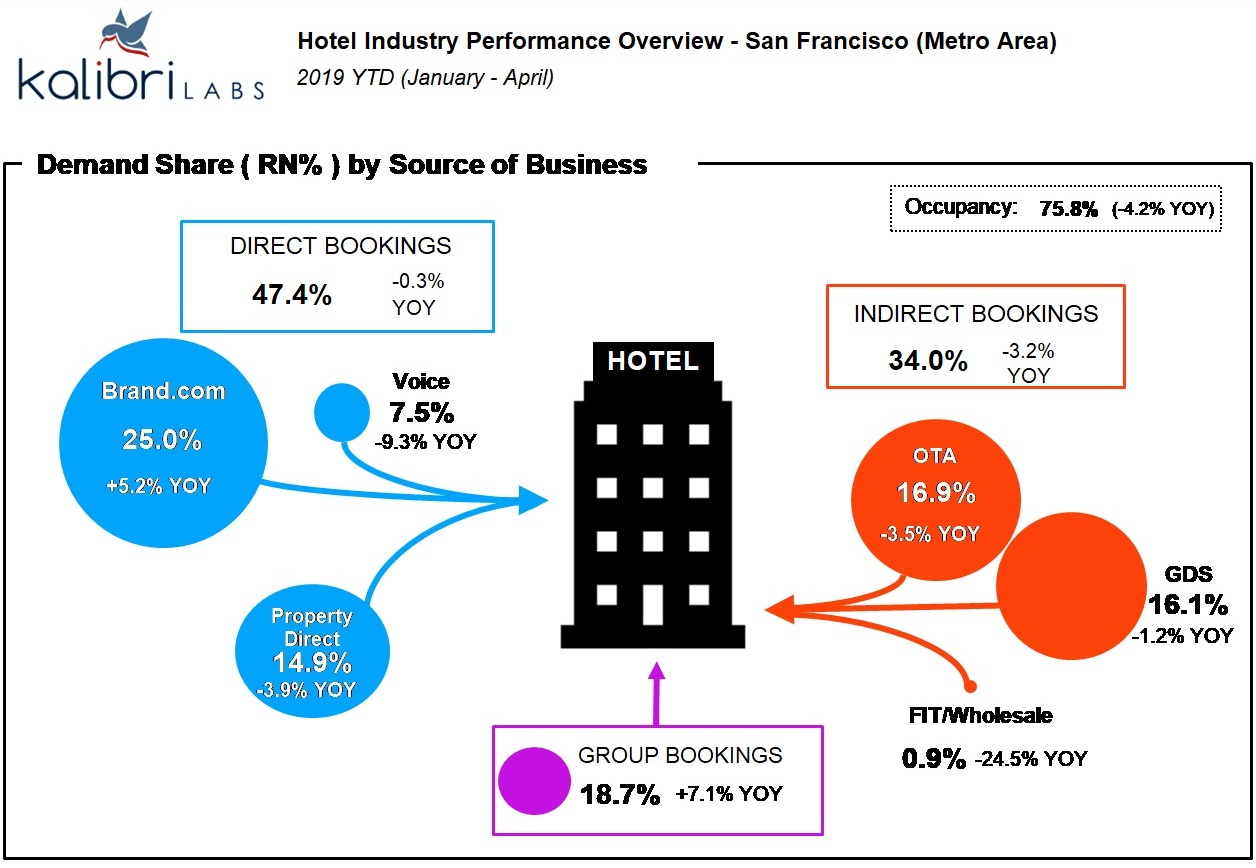
Since the completion of the Moscone renovations, San Francisco’s ADR growth was driven by Brand.com, GDS, and Group business. While most convention center business books within the room block, a substantial portion does not. Group ADR experienced the most growth, +17.41%, making it the highest-COPE ADR channel as of April 2019. Additionally, the Group Room Night Share increased over 7%, making it the second largest portion of the total demand at 18.67%. These factors comprise the Group COPE RevPAR growth of 20.38% as of April 2019 YTD.
Other notable year-over-year performance metrics for April 2019 YTD are outlined below:
-
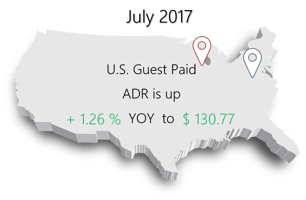
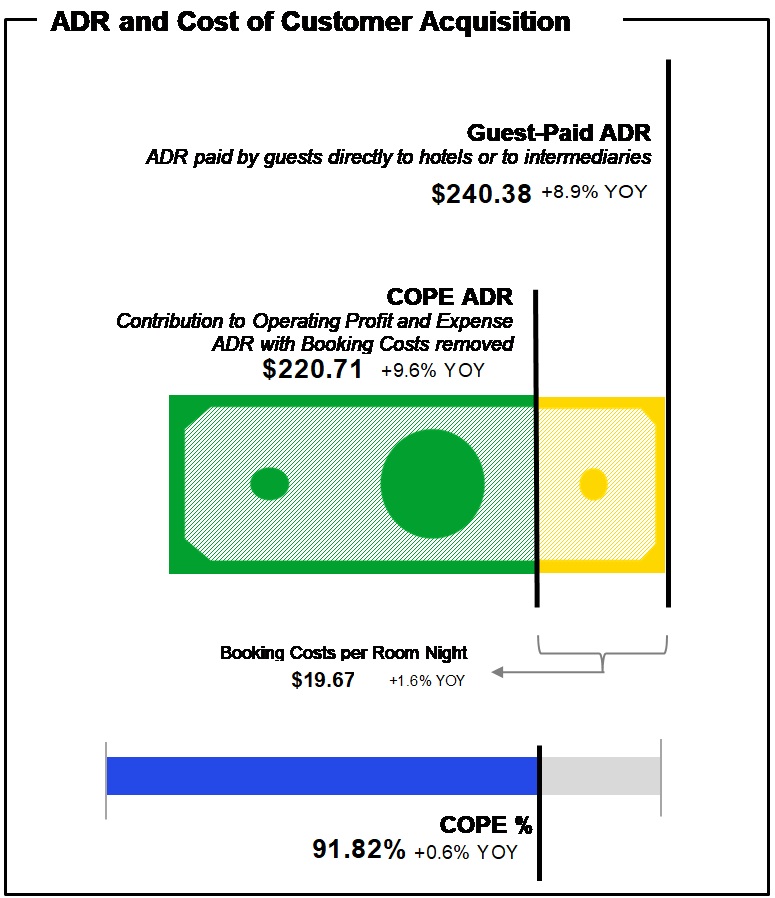
Guest Paid RevPAR was up +6.2%, which is well above the total US performance (-1.6%)
-
Occupancy -4.2%
-
Brand.com Demand Share +5.2%
-
Group Demand Share +7.1%.
-
COPE ADR +9.6%
-
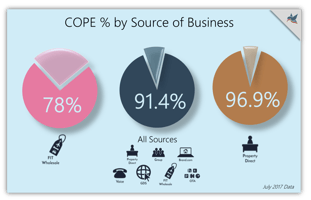
COPE % +0.6%
-
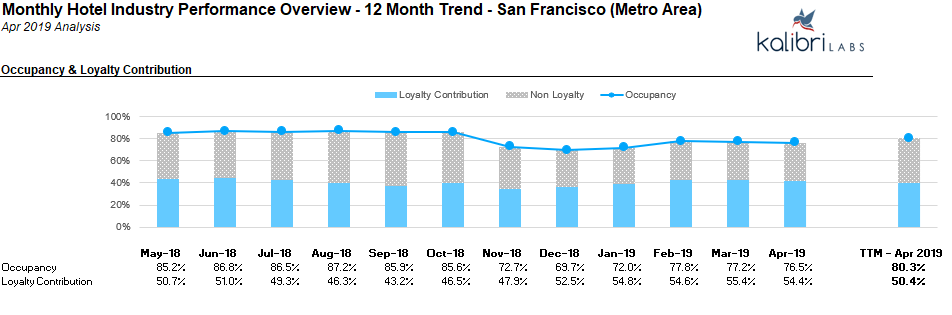
Loyalty Contribution +5.3%
-
Booking Lead Time +3.8%
-
Global Review Index +2.9%
To gain macroeconomic insight and to better forecast revenue projections, consider purchasing HIPO reports in the markets most important to you. Reports are available for the U.S. Market and 25 major MSAs (GEO HIPOs).
Download a sample HIPO report or contact us for questions regarding custom markets.
Appendix:
The Hotel Industry Performance Overview (HIPO) is Kalibri Lab’s market-based hotel industry performance report, which enables key stakeholders in the hotel industry to stay up to date on market trends and improve their business decisions. The report features unique metrics to the industry such as customer acquisition costs, loyalty contribution %, booking lead time, average length of stay and more.
Footnotes:
(1) “$551 Million Moscone Center Expansion A Bid To Win Big Tech Conferences". www.SFChronicle.com, 2019
(2) “San Francisco Tourism Improvement District”. www.SFTID.com, 2019
(3) "California 2020 Countdown: Democratic Contenders Converge In California, Joe Biden Takes A Pass". The Mercury News, 2019