
By: Jeremy Gilston - Manager, Client Solutions
Blog
Back in March 2020, we put our heads together at Kalibri Labs to solve how we could be a resource to the U.S. hospitality industry to weather the storm ahead that was 2020. Being at our core a database company and information provider, we wanted to release data and trends on hotel performance that would give some insights into what was happening to hotel demand around the United States. We launched our Industry Health Dashboard on Kalibrilabs.com comprised of weekly Occupancy and ADR trends for U.S. Hotel Demand, Hotel Closures, Air Travel and Group Pickup/Cancellations.
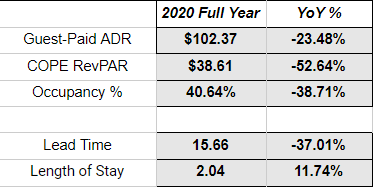
By looking at a combination of actualized hotel demand, airline tickets, and closed hotel supply, we were laying the foundation to understand how business was going to pick up as 2020 went on. And while 2020 was a year of keeping our head down and carrying on, the year did not perform quite as badly as originally projected back in March 2020--finishing at -52% YoY in COPE RevPAR. ADR was also less impacted than originally projected, down only 23% to 2019.
Here are some evolving trends we’ve been tracking for the last 12 months:
-
Longer Lengths of Stay - even with Group and Corporate business being the most impacted demand segments in 2020, overall Length of Stay increased in the United States 11% vs. 2019. If work remote trends continue, hotels can expect guests to be on property longer than typical.
-
Shorter Booking Lead Time - While length of stays are increasing, booking lead time was down almost 40% vs. 2019. If travel restrictions continue to evolve frequently, hotels can expect booking lead time to remain short. Understanding which customer segments are booking at which lead times is critical to capturing the limited demand for Q1 2021.
-
Dramatic demand mix shifts - Group and Corporate business has been greatly depressed in 2020 and will continue to be depressed for the beginning of 2021. Markets that relied heaviest of these two demand segments will need to find other transient business to rely on for the immediate future.
-
Smaller markets weathered the storm better than others - Markets like Panama City FL, Baton Rouge LA, and McAllen TX finished the year less than 15% down in Occupancy compared to 2019. Their ADRs were also within 10% of 2019 performance. Not only are the demand segments within markets shifting but the geography of demand is shifting as well.
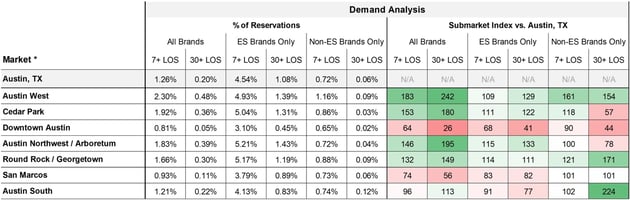
Moving forward, we are seeing recovery patterns vary significantly by both Market and Business Type (rate category). We expect major travel hubs (New York, Atlanta, Seattle) that held large city-wide events to be most significantly impacted in the short term--while secondary and tertiary markets will have a faster recovery. Markets that can rely on drive-in transient demand have a chance to start seeing an increase in demand as early as March 2021.
As a result of those evolving trends, we decided it was time to release version #2 of our Industry Health Dashboard! In addition to the 3 original data points (hotel performance by rate category, airline ticket sales by market, and hotel closed status by chainscale), we are adding some very valuable information on YoY RevPAR performance by Market, Submarket, and Market Location Type.
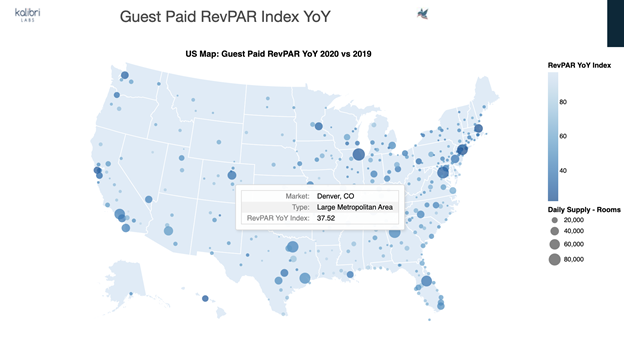
The Guest Paid RevPAR Index by market allows anyone to hover over major markets in the U.S. to see how their performance is trending vs. 2019. For example, Denver CO’s YoY RevPAR Index was 37.52. That means that Denver was down ~63% compared to 2019.
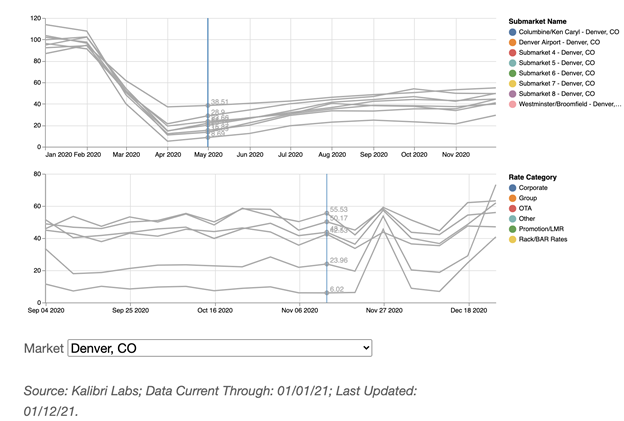
Specific market performance varies significantly by Submarket and Rate Category. Hotels that are only looking at revenue performance in aggregate at the Property Level or comparing their performance to a generic market are at risk of missing local trends that truly affect their core performance.
It is our mission to help sustain the health of the hotel industry by enabling hotel brands, owners and operators to improve profit contribution by evaluating revenue performance net of customer acquisition costs. With so much demand uncertainty, it is as important as ever to understand what customer segments are driving revenue results and what tradeoff decisions exist in the market with regards to capturing demand through direct or 3rd party channels.