Evolving Market Environment
With the U.S. construction pipeline hitting a record high in the fourth quarter of 2023, and recent positive sentiment about deal activity, the industry could see increased competition for hotel assets later this year. As a result, it is critical for key stakeholders to look beyond traditional metrics to make more informed decisions for all activities associated with underwriting, acquisitions, development, re-positioning, and more.
For years, data analytics has played a significant role in the hotel acquisitions, market due diligence, and site selection process. By evaluating top-line ADR, Occupancy, RevPAR and other basic key performance indicators, developers and investors have been able to gain valuable insights into the financial health and performance of any property, competitive set, market, or submarket they may be targeting. However, as the industry has changed over the past several years, and as certain markets and submarkets continue to return to pre-pandemic levels for certain segments, hoteliers are competing for an ever-growing spectrum of demand sources across both commercial and leisure business. It is critical to understand the composition of KPIs and what specific segments are driving demand and the impact of costs associated with each. Kalibri Labs’ CEO & Co-Founder Cindy Estis Green has explained, “Like many industries, the hospitality vertical has been intermediated by large digital tech platforms aggregating consumer demand and it has caused major upheaval for many…” As this digital disruption continues to be a major factor in commercial strategy for hotel properties, underwriting for acquisitions and new development must include a deeper dive into this evolving business mix as ownership groups look to grow their portfolios.
Demand Segmentation
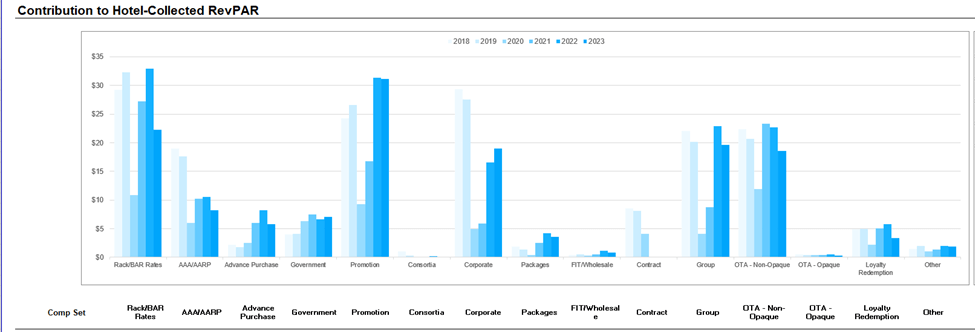
For many years, as part of their due diligence, hotel developers have looked at (among other things) market performance with a focus on top-line base metrics: ADR, Occupancy, RevPAR, Demand, Supply, and Total Revenue with specific focus on the RevPAR Index (Hotel-Collected RevPAR Index) across Group and Transient business as primary indicators of health and performance trajectory. However, with this ever-increasing competition for market share, decision-makers must be able to have access to a more granular picture of business mix. It is important to analyze performance across key segments for leisure demand including discount programs like AAA/AARP and rate categories like Loyalty Member, Packages, Rack/BAR, Promotion/Packages, and OTA. And with the continued importance of monitoring commercial business, stakeholders need to accurately identify demand trends within segments like Corporate, Government, Association, Consortia, Convention, and certain day-of-week Rack/BAR and Loyalty rate classifications.
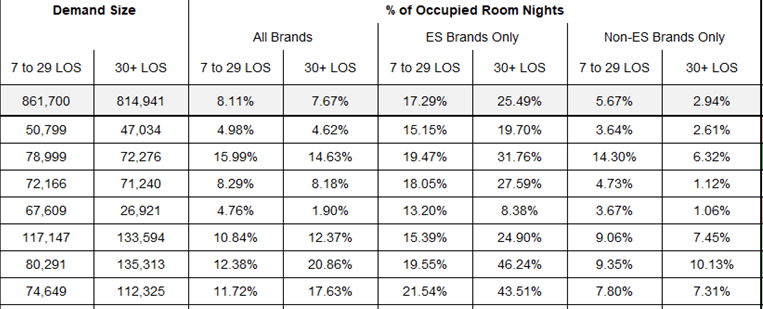
As the pipeline for extended stay hotel development has continued to expand (leading all other hotel types for growth last year), it is also critical to focus on those specific length-of-stay segments that define “extended stay.” The traditional Average Length of Stay (ALOS) metric tells only one part of the performance story. Identifying the demand mix within those 7-29 and 30+ LOS buckets will provide improved guidance for site selection in any of the 334 markets or 975 submarkets in the U.S.
Asset Valuation
On the hotel acquisitions front, real estate developers may use certain methods to determine asset value in determining whether to buy or sell a property as part of the underwriting process. As an enhancement to traditional investor models like present value calculations, Kalibri Labs monitors Revenue Capture from tracking customer acquisition costs across all business segments, which can offer a clearer picture of the impact said costs have on NOI and ultimately, asset value. The following is an example of the impact of overspending by $100,000 (2 basis points) to acquire customers, resulting in over $1M reduction in asset value:
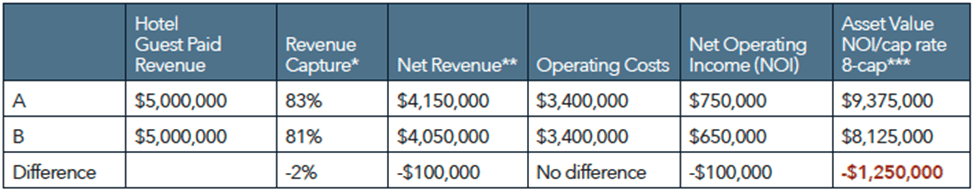
*Revenue Capture% = Net Revenue/Guest Paid Revenue
**Net Revenue = Guest Paid Revenue – Booking + Sales/Marketing costs
***8-cap = capitalization rate used to assess yield of cash flow from a real estate asset; assumes 8% return
Key Takeaway: for as little as a 2-bp decline in Revenue Capture, the hotel loses over $1M in asset value.
Take a Deeper Dive
In today’s digital hotel marketplace, it is imperative that decision-makers consider a deeper look at market demand drivers as well as Revenue Capture when considering any potential deal. By further analyzing the composition of RevPAR, developers, investors, lenders, brokers, appraisers, and other investment professionals can look beyond traditional metrics to make more informed data-driven decisions.
Set up a demo with Kalibri Labs today to learn how our insightful reports and forecasting can aid in more accurate underwriting.