By: Mark Lomanno
Published Articles
By Mark Lomanno
To say that football season is a big deal in the United States is a bit of an understatement. As the 2017- 2018 season kicks off, fans are overwhelmed with a deluge of data. It seems as if the advanced metrics the teams, players and coaches are graded on is ever-evolving and constantly adding to next-gen technology. In fact, workplaces and groups of friends all across America have fantasy football leagues based entirely off of the statistics generated each weekend. This obsession over numerical output isn’t unique to American football, but perhaps the hotel industry could take a page from the football play book and learn to expand our use of industry metrics. As the landscape has changed around us, we haven’t modernized our metrics to keep pace with the new entrants and to keep track of the new costs they present. Monitoring and reacting to hotel health vitals has become of greater importance in the digital age. We must update the collective rubric we use to evaluate success across the industry.
INTRODUCING NEW METRICS
image-block-outer-wrapper
layout-caption-below
design-layout-inline
"
data-test="image-block-inline-outer-wrapper"
>
sqs-block-image-figure
intrinsic
"
style="max-width:799px;"
>
class="image-block-wrapper"
data-animation-role="image"
data-animation-override
>
>
The Hotel Industry Performance Overview, or HIPO for short, offers a new scoring system for the hotel industry that sheds light on key performance indicators that were once previously unavailable or difficult to obtain at scale. HIPO is generated monthly from the Kalibri Labs database of more than 26,000 hotels from 100 brands, which represents three million rooms, five billion transactions and the cost of customer acquisition for nearly six years of data. Access to this aggregated data allows the industry to supplement hotel collected revenue and basic occupancy metrics with data and insights that paint a much more granular portrait of trends. Because the data is obtained at the individual transaction level before it is aggregated, the cost of acquisition data can be isolated, which we can then derive Net Revenue (Contribution to Operating Profit and Expense [COPE]) and break it down by its source of business.
TOTAL U.S. RESULTS IN 2016
In 2016, The U.S. Hotel Industry saw direct channels lose room night share year-over year, primarily from the significant decline in direct booking.
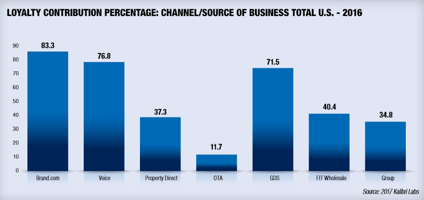
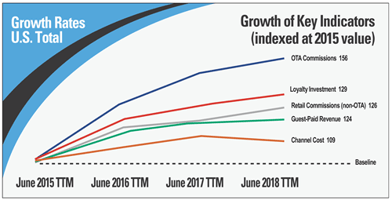
In 2016, the U.S. hotel industry saw direct channels lose room night share (2.8 percent) year-over-year (YOY), however, brand.com bookings were up 4.7 percent. The significant decline in direct channel room night share was primarily due to a decrease in property direct bookings (7.7 percent), and also because of a decline in voice bookings (3.7 percent). Demand has continued to shift to indirect sources, increasing considerably (8.7 percent) YOY. The growth in indirect channel demand share primarily stemmed from increased dependency on OTA bookings (15.4 percent) as well as GDS bookings, which were up over 2015 (2.9 percent). Some additional key takeaways from the 2016 data:
» Group business room night demand share was mostly flat to slightly down, year-over-year, but saw a notable increase in guest-paid ADR in the channel up 3.74 percent from 2015.
» While guest-paid ADR showed sluggish growth throughout all sources of business, the OTA channel was the only one where guest-paid ADR declined.
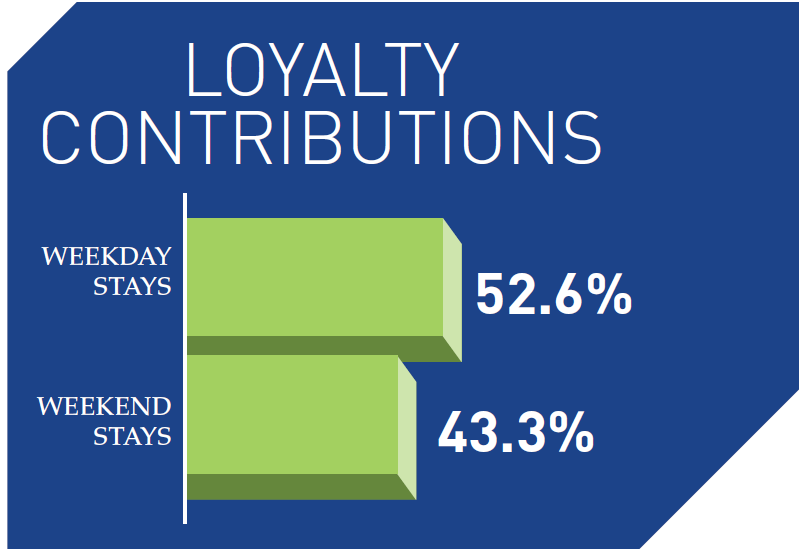
» Loyalty contribution, or the percentage of room nights generated by loyalty members, continues to be higher for weekday stays (52.6 percent), however weekends (43.3 percent) are closing the gap. This is likely because of the growth that loyalty programs have been experiencing (8.34 percent increase YOY).
» Throughout the industry, booking lead time is up from 2015, but length of stay is down. While this may seem counterintuitive, it is certainly a trend to keep an eye on as we progress through 2017.
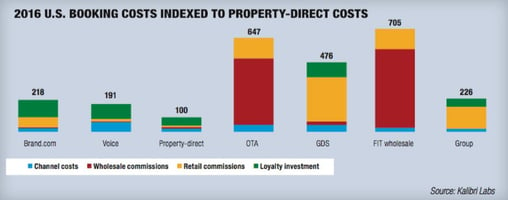
» While cost of sales increased YOY, it appeared to be a result of the increase in guest-paid ADR and the resulting commissions of that increase because COPE percent, or the percentage of revenue that hotels retain after paying direct customer acquisition costs, was flat YOY (0.1 percent) indicating the industry is keeping the same percentage of the total room revenue generated.
FURTHER SEGMENTATION IN RESULTS
Booking lead time was up in most of the property size and guest-paid ADR segments with the larger, more expensive properties leading all segments with a booking lead time of 42.82 days for hotels with guest-paid ADR of $300+ and 35.80 for hotels with 501 rooms or more. Loyalty contribution was in the 50-60 percent range for all price points and property sizes, with the exception of the smallest and lowest priced segments. Length of stay was down across most segments, with few very minor exceptions.
Prior to HIPO, all these data points were trapped inside the disparate PMS and CMS of different brands. With the data freed, aggregated and then deconstructed across key segments, the fiscal wellbeing of our industry can finally be analyzed at the detailed level it deserves and that the modern-day, stats-driven fantasy football enthusiast has come to expect.