

In the first four segments of this series we’ve explored the value in upgrading your KPIs to track...
Blog
A Philadelphia Analysis
By: Jeremy Gilston - Manager, Real Estate Revenue Strategy

Understanding and utilizing the following three metrics will have drastic implications on the type, size, and level of finishings (chain scale) selected for a hotel development in a major downtown urban area when compared to the outskirts of that same market.
So what additional unique data can a developer utilize to make better development decisions?
1. Channel Mix
2. ADR By Channel
3. Booking Lead Time by Channel
With rising labor costs and interest rates at this stage in the cycle, development opportunities are becoming harder to find. Today we’ll review a Hotel Industry Performance Overview report to compare the downtown Philadelphia market (Center City) to the larger Philadelphia MSA to explore how Kalibri Labs’ granular data can allow for better-informed investment decisions.
Downtown vs surrounding suburbs.
As expected, the downtown Philadelphia market, Center City, experiences higher RevPAR than the larger Philadelphia MSA, which includes Center City in addition to the surrounding suburbs (Appendix 1). This is due to diversified and increased demand, compression nights, city-wide events, in addition to other macroeconomic forces that exist in a downtown urban market. As such, in 2018, Center City experienced the following when compared to the larger Philadelphia MSA:
Occupancy - + 9%
Guest-Paid ADR - + $58
COPE RevPAR - + 60%
Sure, building costs such as materials, land, and labor are central considerations when looking to build a hotel in a major city as opposed to its suburbs, but what about channel mix?
Channel Mix
Philadelphia MSA
Group – 18%
Property Direct – 20%
Philadelphia Center City
Group – 34%
Property Direct – 9%
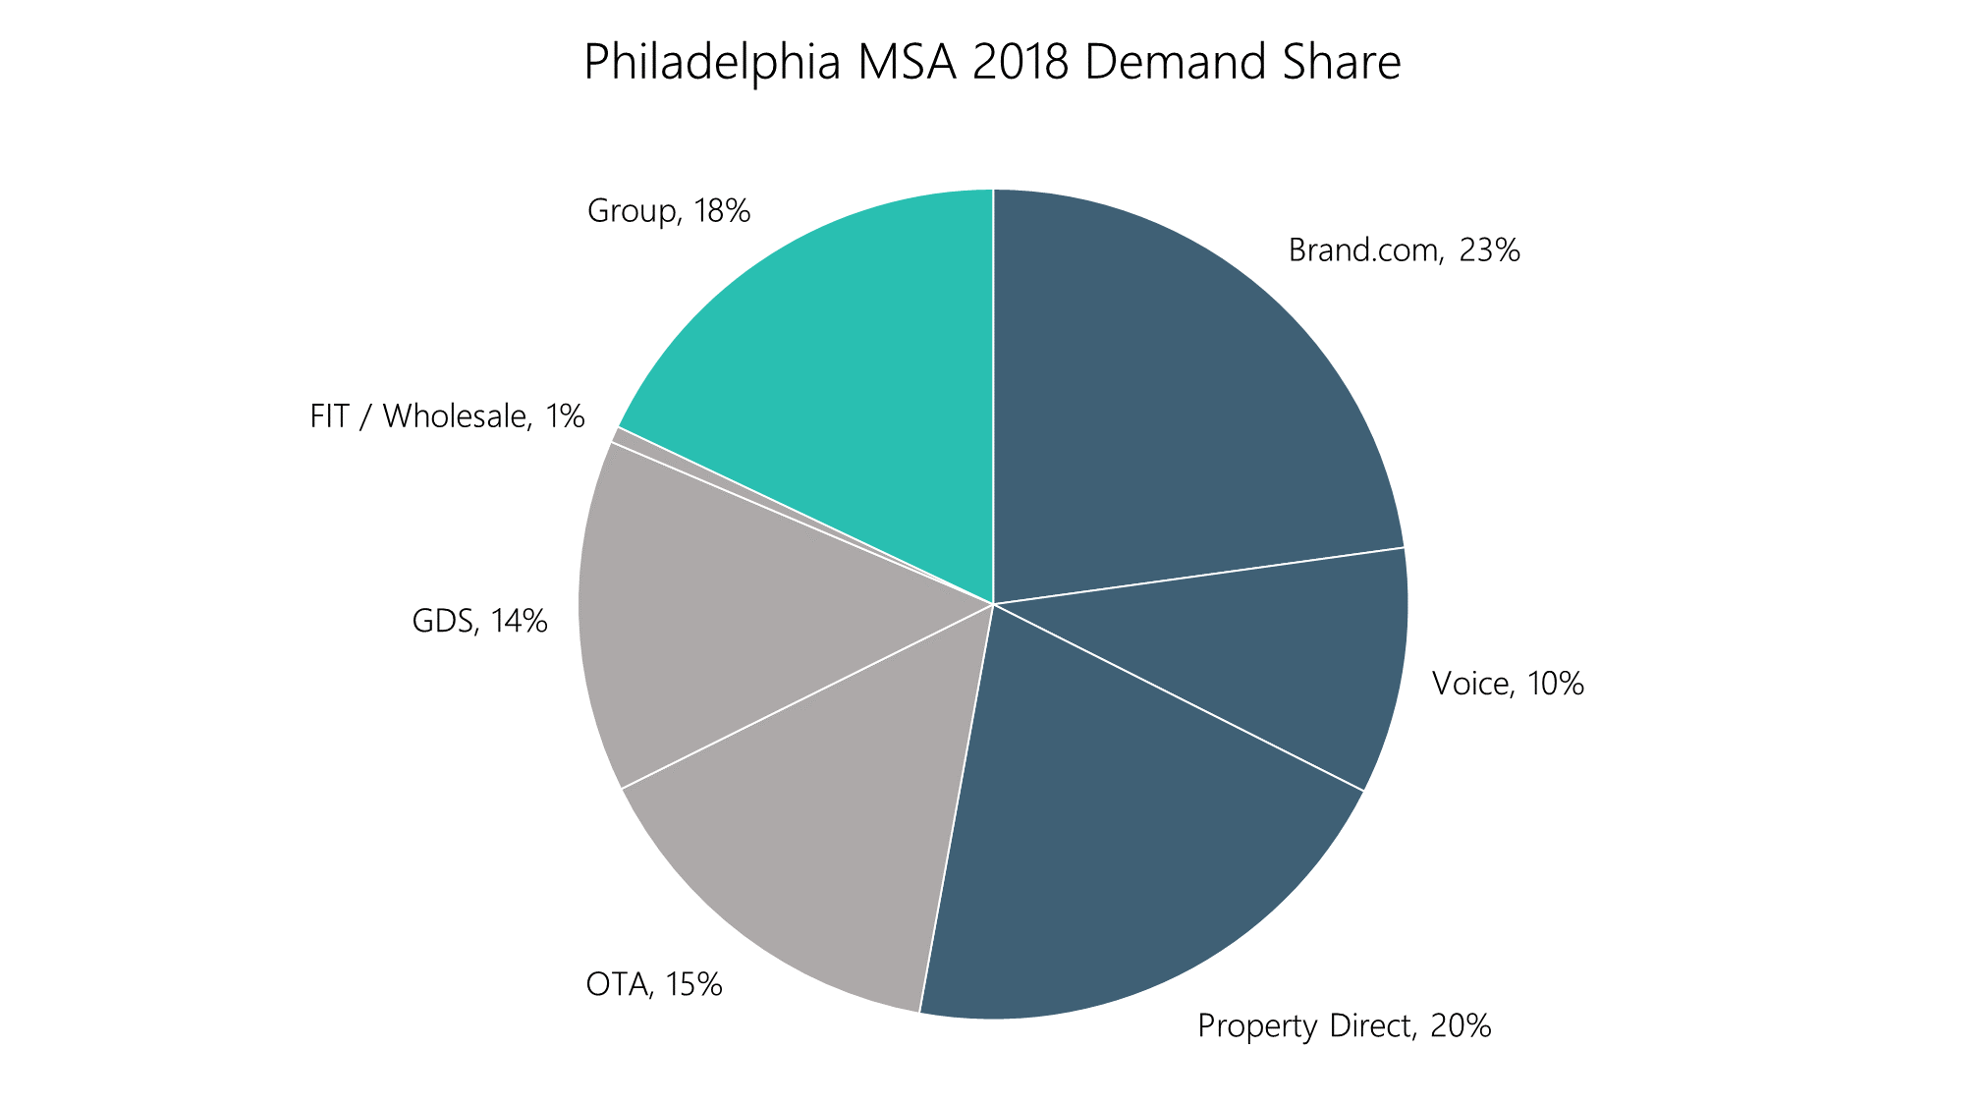
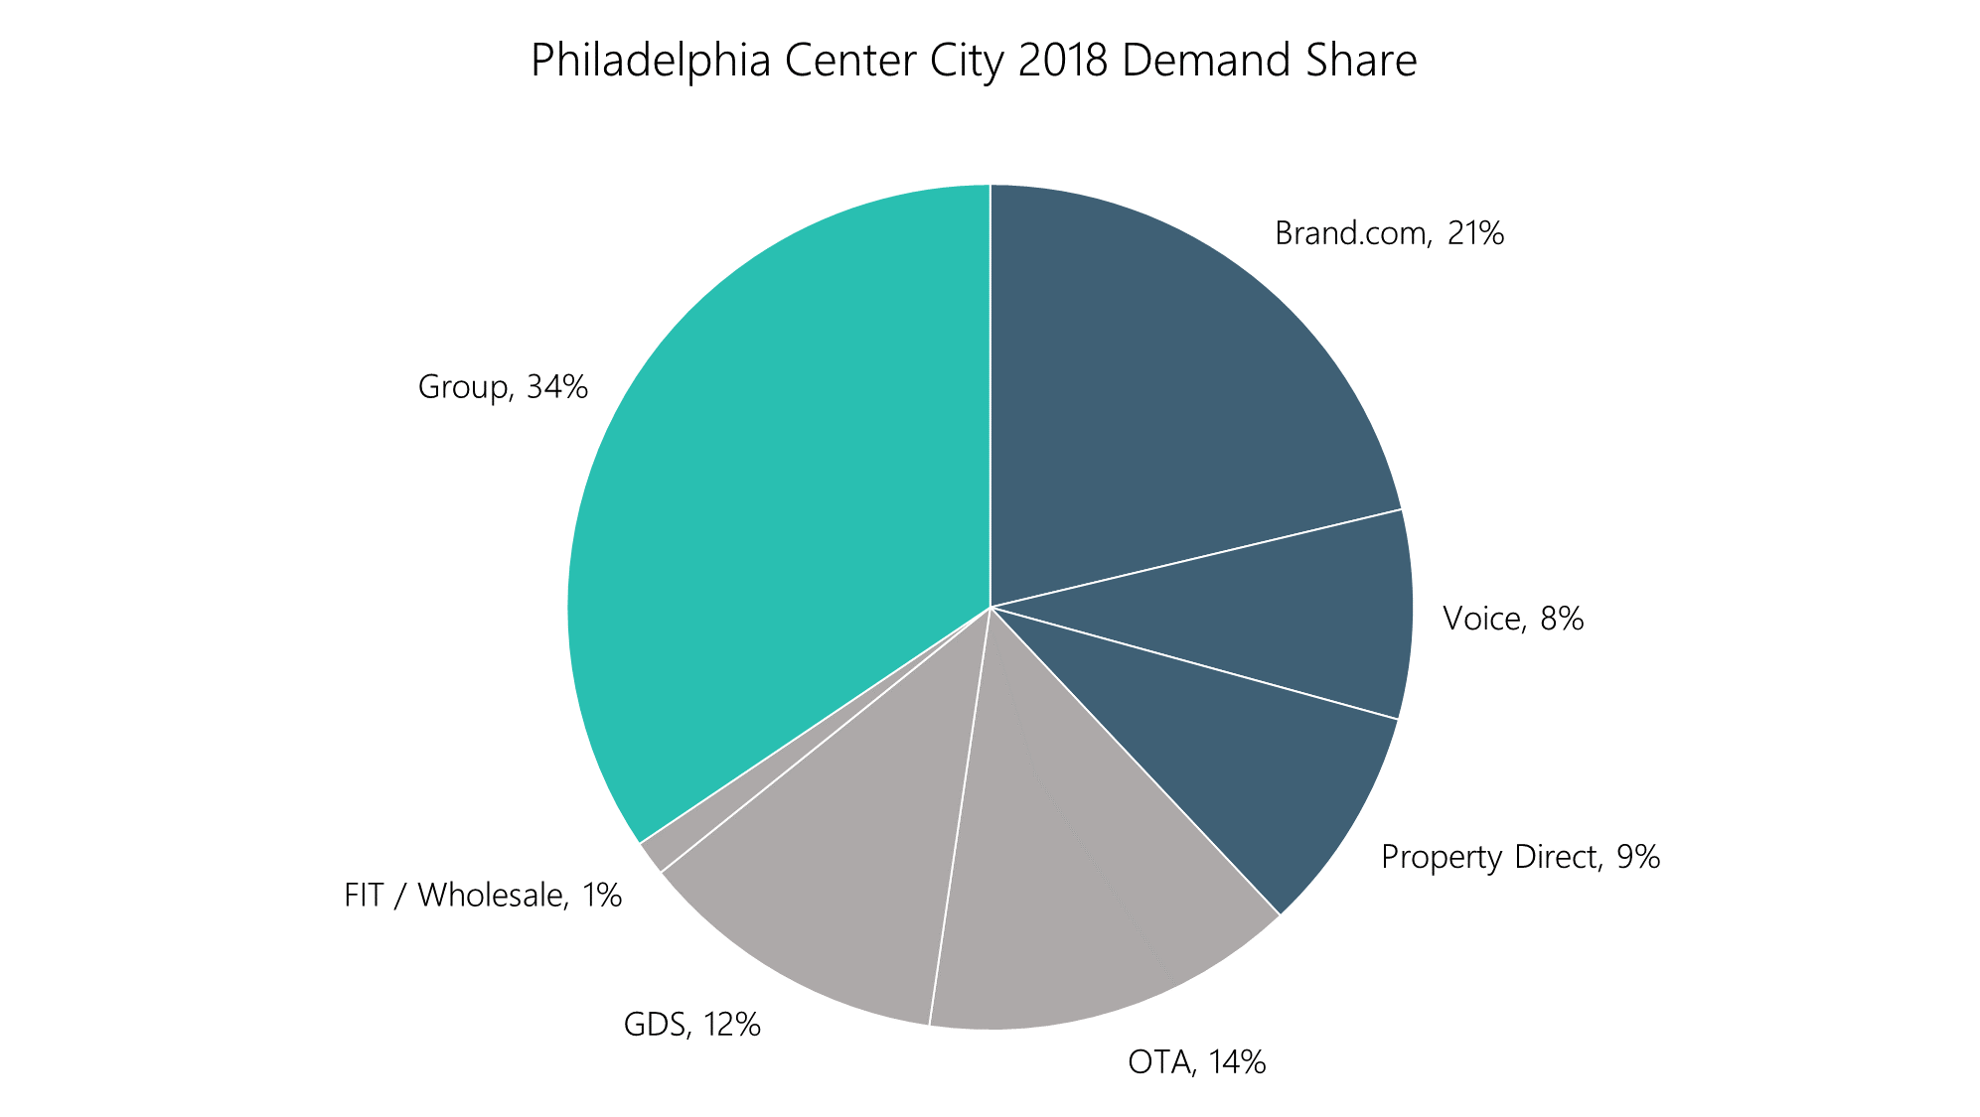
This channel mix breakout will help a developer identify just how much meeting square footage is required to capture group demand.
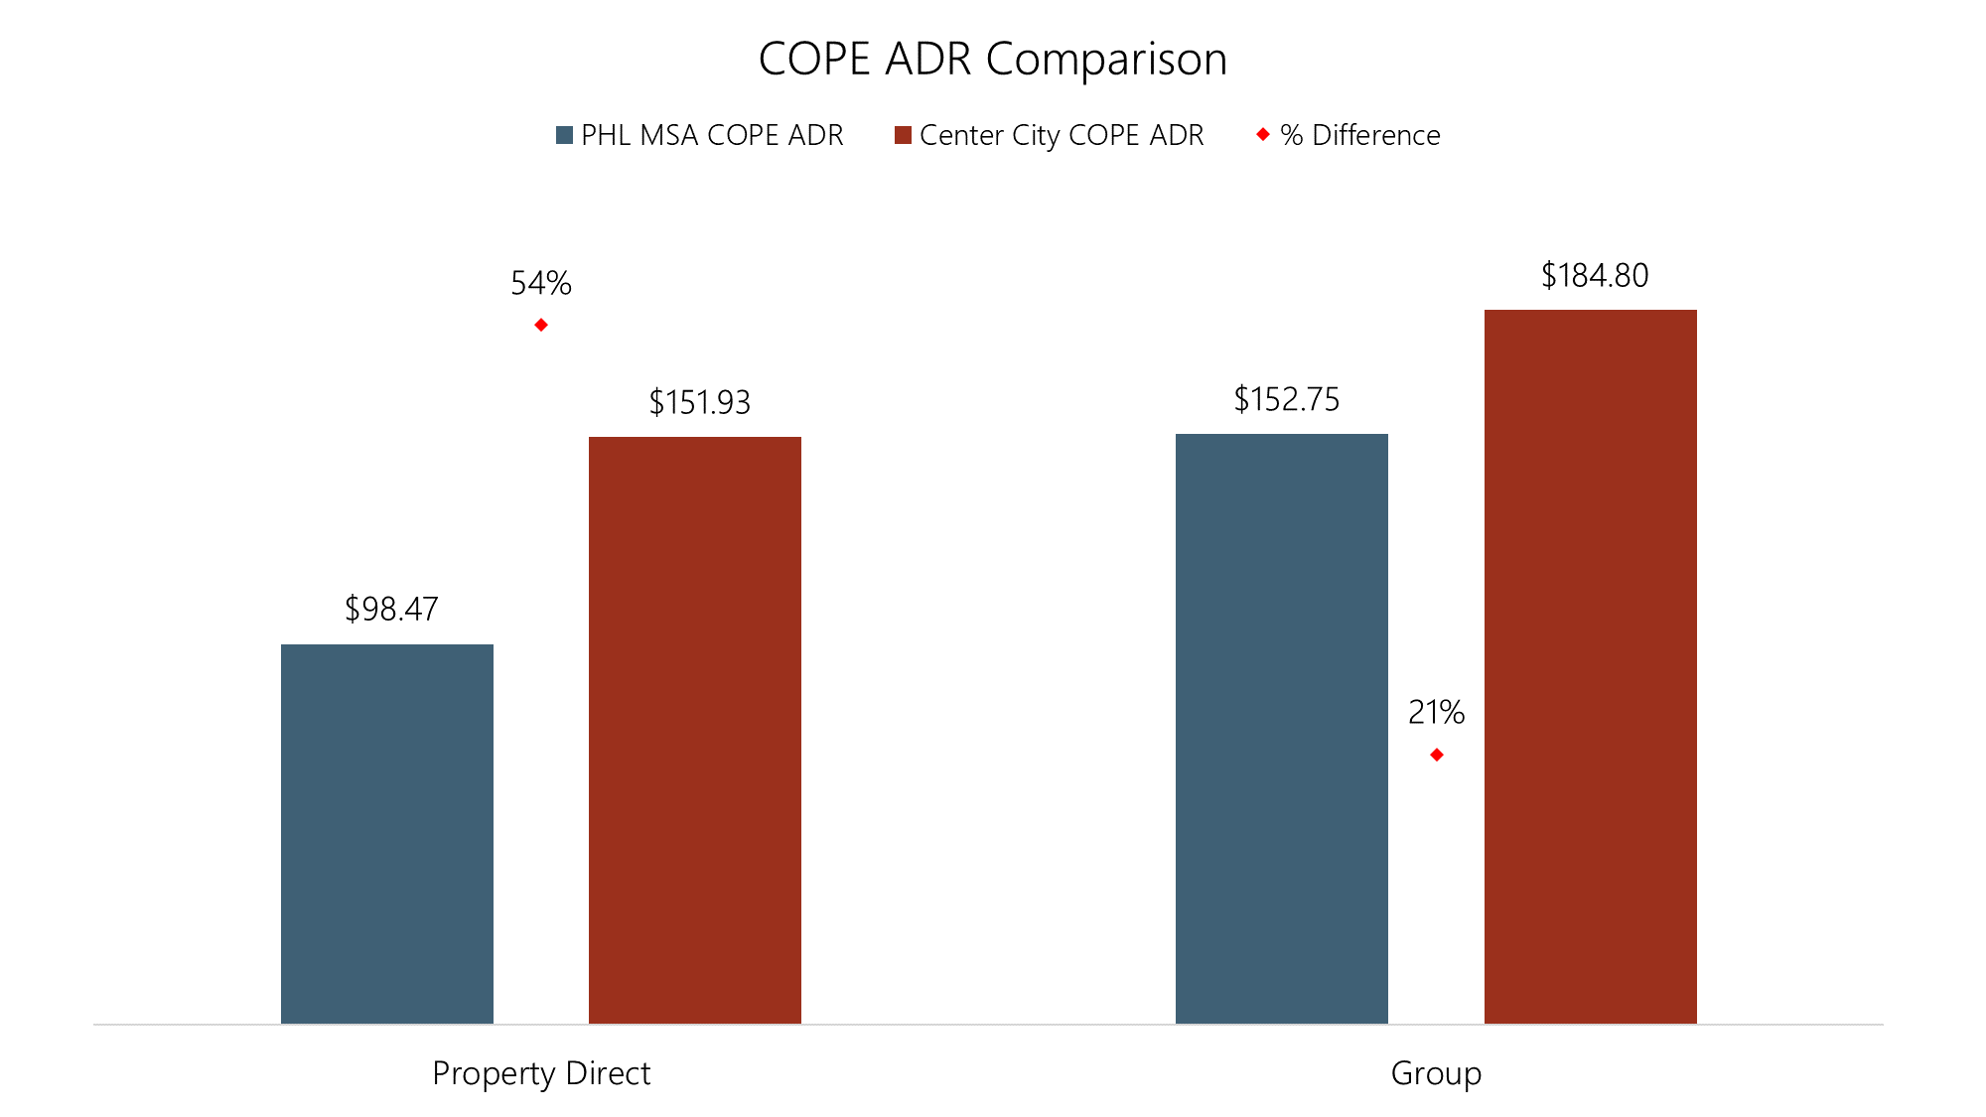
ADR by Channel
The graph below outlines the rate differential between the previously addressed sources of business. A top-line analysis must be done to understand the channel mix trade-off when determining a development site. Group has the highest ADR in the Philadelphia MSA and third highest in Center City, whereas the Property Direct ADR is 50% less in the Philadelphia MSA as compared to Center City. Therefore, (and as a former underwriter, myself) a developer’s underwriting model should project the additional revenue by channel in order to make the most informed investment decision:
Group Revenue = Captured Group Demand x Group ADR
This analysis should also include an ancillary revenue per occupied room (POR) estimation to account for additional revenues not captured in the Group ADR. Ancillary revenues typically include meeting room rentals, food and beverage, AV equipment, and more.
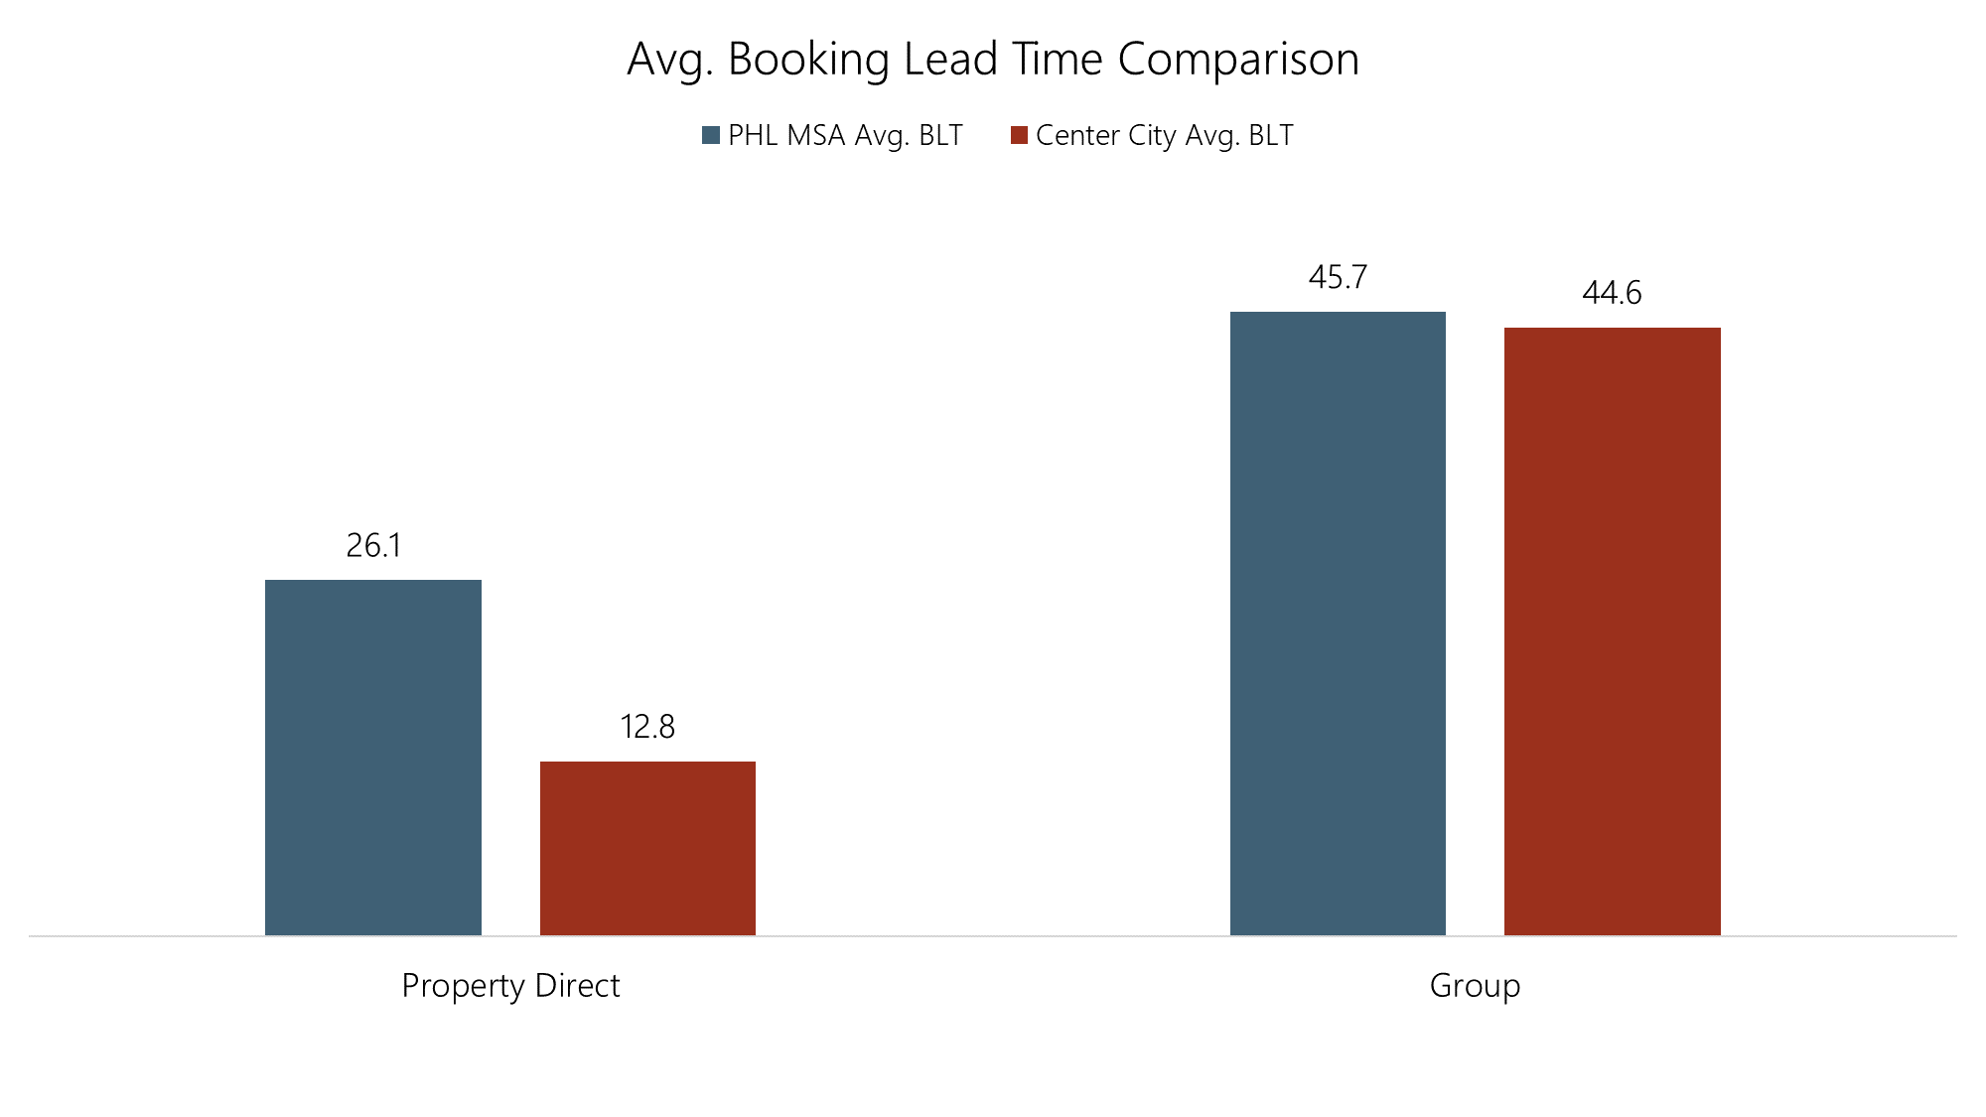
Booking Lead Time by Channel
Another valuable metric in this analysis is booking lead time by channel. Group business in both Center City and the greater Philadelphia MSA both have about a ~45 day booking lead time. It is important to consider that Property Direct (Appendix 2) books less than two weeks out in Center City and has a longer lead time in the Philadelphia MSA. This means that a group-heavy Center City hotel can fill roughly a third of its available rooms with high-rated Group business a month and a half in advance.
Understanding this has implications for the rest of the channel mix as well as sales and marketing costs and may ultimately allow the hotel to be less reliant on more expensive indirect channels such as online travel agencies (OTAs).
Conclusion
Before conducting a highest and best use analysis, know what data is now available to you. If a developer is considering building a hotel in a downtown area or a suburban area, they will make a better-informed decision when considering these three important metrics: demand mix, ADR by channel, and booking lead time by channel. These metrics inform how a developer can build the optimal hotel and staff a sales and marketing department to capture the highest-rated business with the lowest-associated expenses.
To learn more about our suite of hotel development reports and specialized insights for the hotel investment ecosystem, please schedule a demo.
Consider purchasing a HIPO Report to gain macroeconomic insights into a market before spending millions to develop a hotel.
Appendix 1 – Geographic Definitions
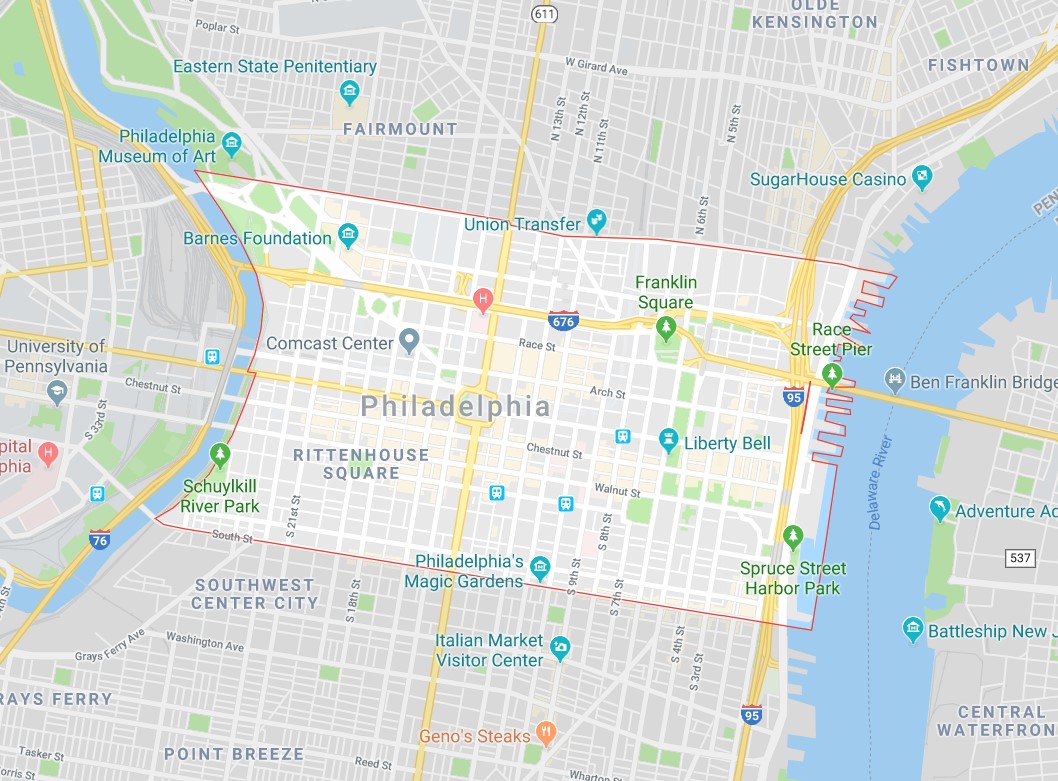
Center City Philadelphia (Defined as Zip Codes - 19102, 19103, 19104, 19106, 19107)
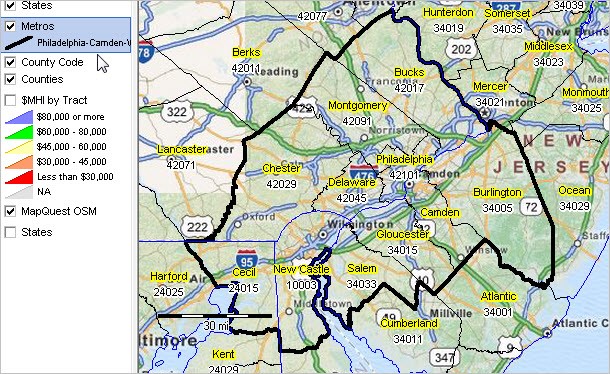
Philadelphia MSA (Defined as Counties - New Castle County, DE (10003); Cecil County, MD (24015); Burlington County, NJ (34005); Camden County, NJ (34007); Gloucester County, NJ (34015); Salem County, NJ (34033); Bucks County, PA (42017); Chester County, PA (42029); Delaware County, PA (42045); Montgomery County, PA (42091); Philadelphia County, PA (42101)
Appendix 2 – Definitions
REVENUE TYPES
COPE Revenue
COPE stands for Contribution to Operating Profit and Expenses and is a form of net revenue after booking costs are deducted from Guest Paid Revenue. These costs include channel and transaction fees, retail and wholesale commissions, loyalty fees, and amenity costs (luxury hotels only). COPE Revenue does not account for Sales and Marketing expenses.
Guest Paid Revenue
The amount of revenue a guest pays for a booking, whether they pay the hotel directly or a third party. This includes the portion the hotel keeps plus the wholesale commission paid directly to a third party such as a traditional wholesaler or OTA (merchant model or opaque).
CHANNEL DEFINITIONS
Group
Bookings from Group market segments, regardless of the booking channel.
Property Direct
Transient bookings made with the property directly. Typically includes reservations made with the front desk through walk-ins or calls as well as contract/crew bookings. This does not include groups/meetings, rooming lists or other sources that are tracked separately.
Voice
Transient bookings made through a call center, central reservations office, or on property reservations desk.